Blog

  • LifeSciences Design Platform

    LifeSciences Design Platform

    [et_pb_section fb_built=”1″ admin_label=”Header & Blog” _builder_version=”4.20.0″ _module_preset=”default” collapsed=”on” global_colors_info=”{}”][et_pb_row _builder_version=”4.20.0″ _module_preset=”default” custom_margin=”-58px|auto||auto||” global_colors_info=”{}”][et_pb_column type=”4_4″ _builder_version=”4.20.0″ _module_preset=”default” global_colors_info=”{}”][et_pb_text _builder_version=”4.20.0″ _module_preset=”3524300f-60fc-446a-9fc9-6d20ad25e446″ text_orientation=”center” global_colors_info=”{}”]

    Blog

    [/et_pb_text][et_pb_post_slider posts_number=”3″ _builder_version=”4.20.0″ _module_preset=”aec34d87-aa08-45f2-a12a-97b566683cfb” locked=”off” global_colors_info=”{%22gcid-1b4a3854-7b44-49f6-922e-e1ac36476373%22:%91%22bg_overlay_color%22%93}”][/et_pb_post_slider][/et_pb_column][/et_pb_row][et_pb_row _builder_version=”4.20.0″ _module_preset=”default” global_colors_info=”{}”][et_pb_column type=”4_4″ _builder_version=”4.20.0″ _module_preset=”default” global_colors_info=”{}”][et_pb_blog posts_number=”6″ _builder_version=”4.27.4″ _module_preset=”4ea61a12-a593-440e-8dd4-cc22497b5eb2″ body_text_align=”left” body_text_color=”#000000″ locked=”off” global_colors_info=”{%22gcid-86031d5b-0170-405c-b57e-166734aa8a67%22:%91%22read_more_text_color%22%93}”][/et_pb_blog][/et_pb_column][/et_pb_row][/et_pb_section][et_pb_section fb_built=”1″ admin_label=”Subscribe” _builder_version=”4.20.0″ _module_preset=”default” collapsed=”on” global_colors_info=”{}”][et_pb_row custom_padding_last_edited=”on|desktop” _builder_version=”4.20.0″ _module_preset=”default” background_color=”gcid-095f3017-670a-4d45-bbf8-520034f23a92″ custom_padding=”60px|60px|60px|60px|true|true” custom_padding_tablet=”30px|30px|30px|30px|true|true” custom_padding_phone=”20px|20px|20px|20px|true|true” border_radii=”on|40px|40px|40px|40px” global_colors_info=”{%22gcid-095f3017-670a-4d45-bbf8-520034f23a92%22:%91%22background_color%22%93}”][et_pb_column type=”4_4″ _builder_version=”4.20.0″ _module_preset=”default” global_colors_info=”{}”][et_pb_text _builder_version=”4.20.0″ _module_preset=”0e9d27f6-07fd-43e4-a2a4-4d27894d9519″ text_orientation=”center” global_colors_info=”{}”]

    Subscribe

    [/et_pb_text][et_pb_signup mailchimp_list=”undefined|elegantthemestest|1ea2bbd026″ first_name_field=”off” last_name_field=”off” _builder_version=”4.20.0″ _module_preset=”6400ac44-87ca-4c1a-a451-c7df879427de” max_width=”700px” module_alignment=”center” locked=”off” global_colors_info=”{}”][/et_pb_signup][/et_pb_column][/et_pb_row][/et_pb_section]
  • Customized Synthetic Data

    Customized Synthetic Data

    In this article we cover how DataSDR generates customized Synthetic Data to improve your software development and debugging processes.

    You can download a paper we presented at the PharmaSUG 2021 event.

    There are several types of data we provide our clients: “Open Data” vs. “Green Data” vs. “Red Data.”
    * “Open Data” refers to data freely available from both academic and government agencies.
    * “Green Data” is Synthetic Data we generate to closely match the specific requirements defined in the metadata (see our Metadata Repository platform for details).
    * “Red Data” is Synthetic Data purposefully created outside of the boundaries and parameters defined in the metadata.

    For example: let’s say you need large amounts of Synthetic Data to develop, debug, and demo your EDC (“Electronic Data Capture”) software platform. Here’s how each type of data can be useful to your organization:

    First, we define all the data types your software uses into our Metadata Repository (“MDR”). From individual fields up to forms (CRFs) and study definitions (based off Protocols).

    In the Develop phase: we generate “Green Data” that matches the specific parameters defined in the MDR. For a particular CRF, we can generate hundreds or even thousands of records that match the exact field structure, field type, and allowed values for each field. For a field “Age”, defined as integer, with a range between 0 and 120, we’ll generate integer values between 0-120 as expected.

    In the Debug / Test phase: we generate “Red Data” that explicitly falls outside the expected values. For the “Age” field we’d generate records with string data as opposed to integers. And with integer values above 120. The goal of using “Red Data” is to verify that the system performs the expected checks and validations.

    In the Demo phase: your sales team can showcase your software pre-loaded with large amounts of Green Data. Your team will then showcase all areas of your software with realistic, yet totally fake data.

    Ready to improve your software?

    Contact us today to evaluate how DataSDR can add value to your software.

  • Using Open Data to Improve LLMs

    Using Open Data to Improve LLMs

    In this article we’ll explore how Open Data can be used to improve Large Language Models (“LLMs”).

    We wrote a full paper on using our Open Data Repository to train an LLM model, please download it here.

    First of all, we believe that using Open Data provides your models with a massive amount of “ground truth” for training purposes. We can safely assume that most Open Data available today (say, from FDA filings) was written by human Subject Matter Experts (“SMEs”), using both proper language as well as appropriate scientific arguments.

    Secondly, there are massive amounts of Open Data available for almost every industry and market vertical. Since most industries are under a certain level of government regulation, the agencies that regulate each industry in turn disclose as Open Data many of each agencies’ activities about that industry.

    Thirdly, by training LLMs on this Open Data your model will be able to acquire the “lingo” of each industry you provide the model Open Data from. This is important to give the output of your model higher credibility.

    We wrote a document that guides you through the process of setting up your own local LLM development environment, running in your local computer. Download the document here.

    Continuum of Reality

    Our Open Data and our Synthetic Data capabilities can help your customers to more quickly build and validate ML models. We use the analogy of a “Continuum of Reality.” Where real reality is on the right side edge, and synthetic reality is on the left side edge.

    Our premise is that using Open Data can provide the “ground truth” for many models. For example: the drugs approved by the FDA is the last 30 years is reality, from the authoritative source. And the Medicare reimbursements per doctor in Florida is real reality. This Open Data is the right side edge of the continuum.

    Synthetic Data provides the other extreme, the “negative ground truth”: the results of a model should never look like the totally-random Synthetic Data. A client wants to test their reimbursement model with 100K random Medicare providers? We can support that.

    Your customers’ models should generate results between these 02 extremes.

    From a business perspective, your company can both increase the value of its platform as well as generate ancillary revenue by offering your customers both Open Data as well as Synthetic Data to go with each model.

    Available Data

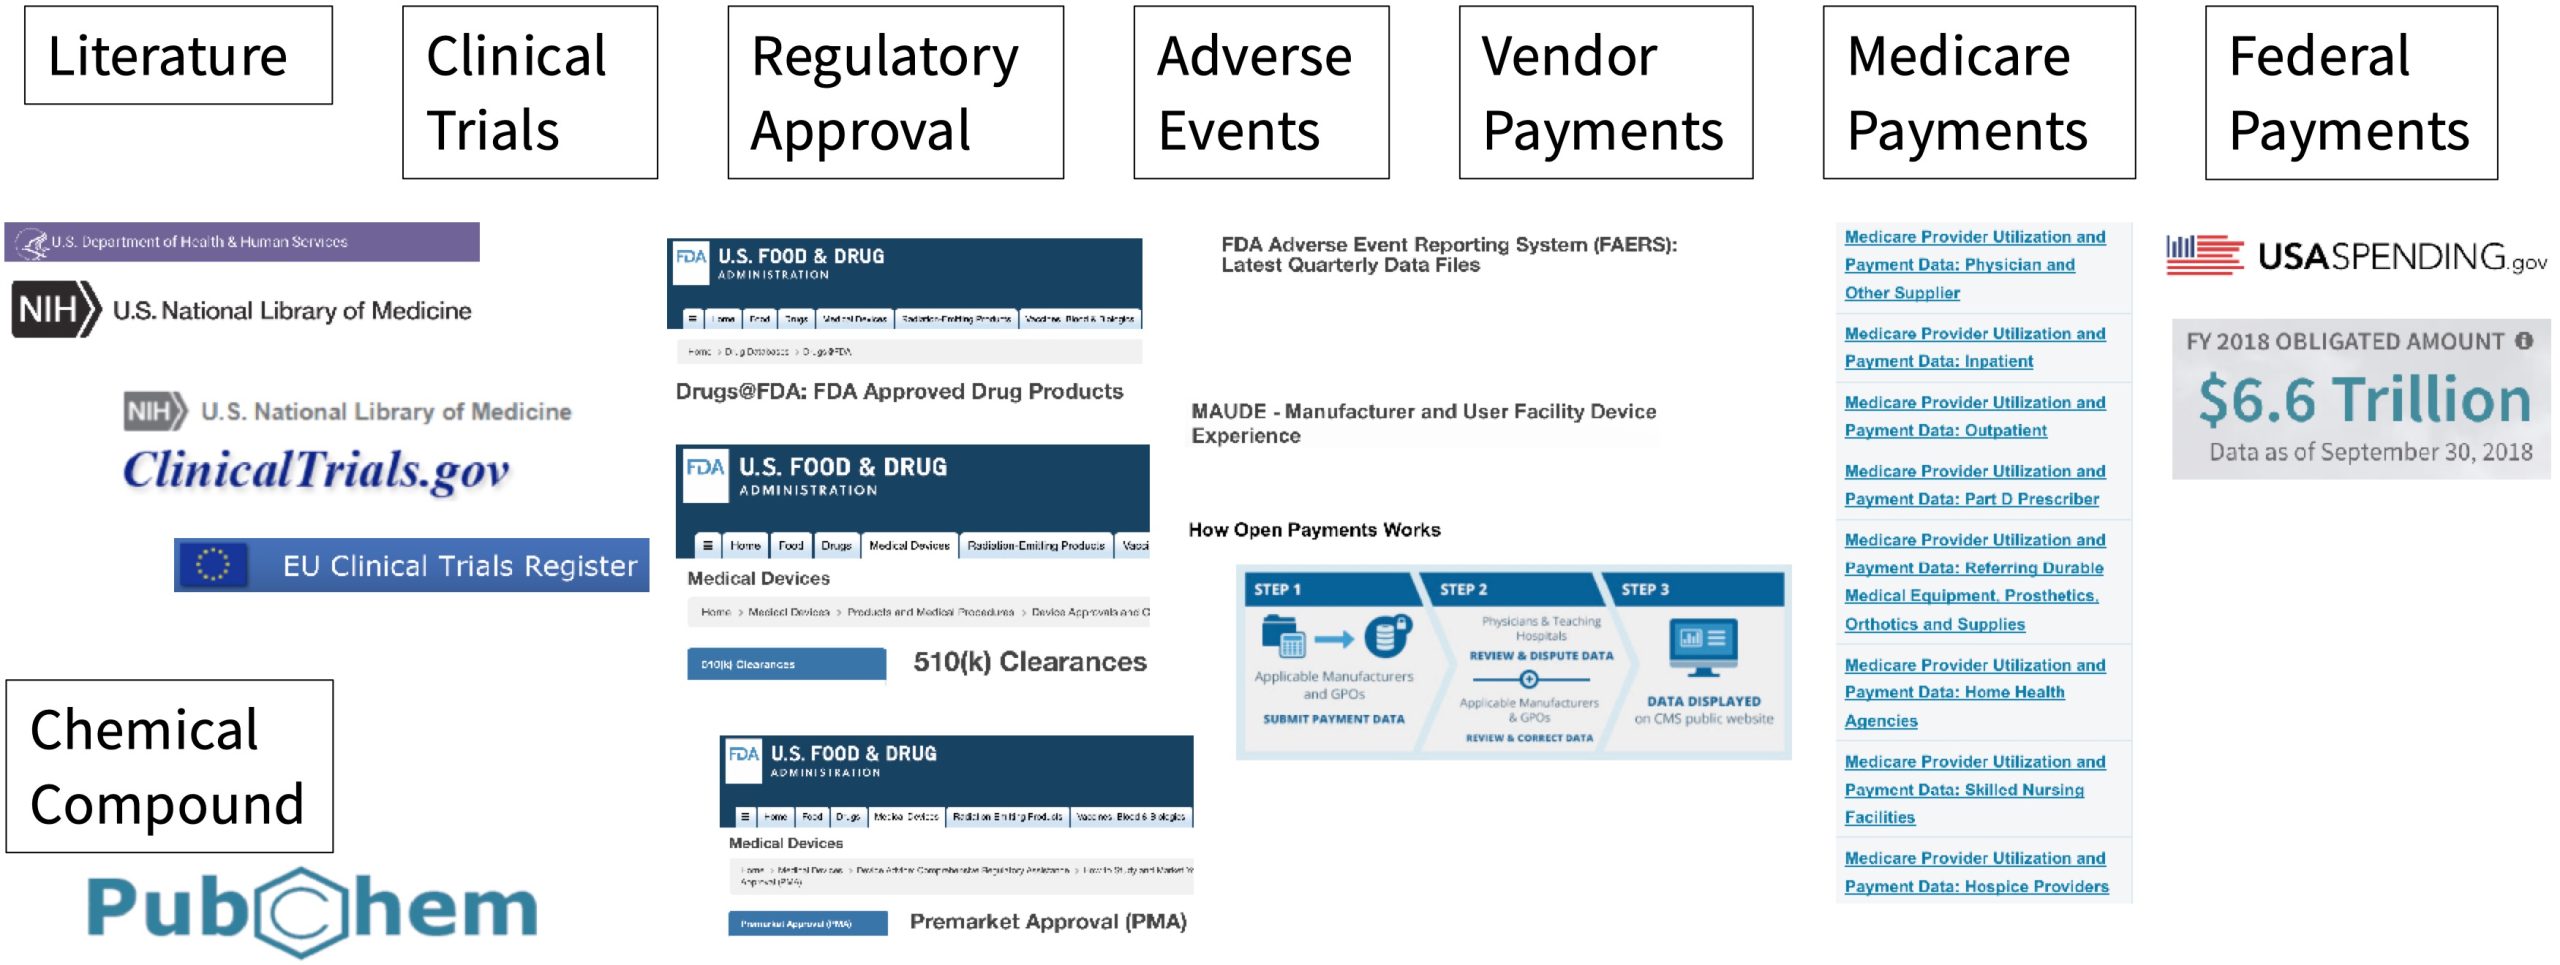
    Our Open Data Repository represents the “Ground Truth” of what has happened in the pharma and medical device spaces in the US for the last 30 years. Including:
    * 40,000+ Protocols, SAPs, ICFs
    * over 100,000 FDA application files
    * 110,000 full FDA labels (“SPL”)

    You can use this data to train your models with the text extracted from all those documents, containing 600+ million words. We can also include additional Open Data from other US agencies, including:
    * CMS – Medicare
    * HHS – healthcare
    * NLM – references

    Ready to train your models with Open Data?

    Contact us today to evaluate how DataSDR can add value to your software.